
How much water is in the river?
This is a difficult question to answer for many reasons—the shapes of rivers and creeks are constantly changing and they are fed by underground springs, rain, and other systems whose flows are also dynamic. In Clatsop County you can see real-time flow data from the US Geological Survey (USGS) for the Nehalem River near Vernonia and near Foss, as well as Oregon Water Resources Department (OWRD) real-time data for West Fork Ecola Creek and North Fork Ecola Creek.
With increasing numbers of people relying on our water resources, more impermeable surfaces that route water away from underground aquifers, and a changing climate, it’s important to know how much water is flowing so that all creatures (people included) can continue to have the water we need. Water quality starts with having water!
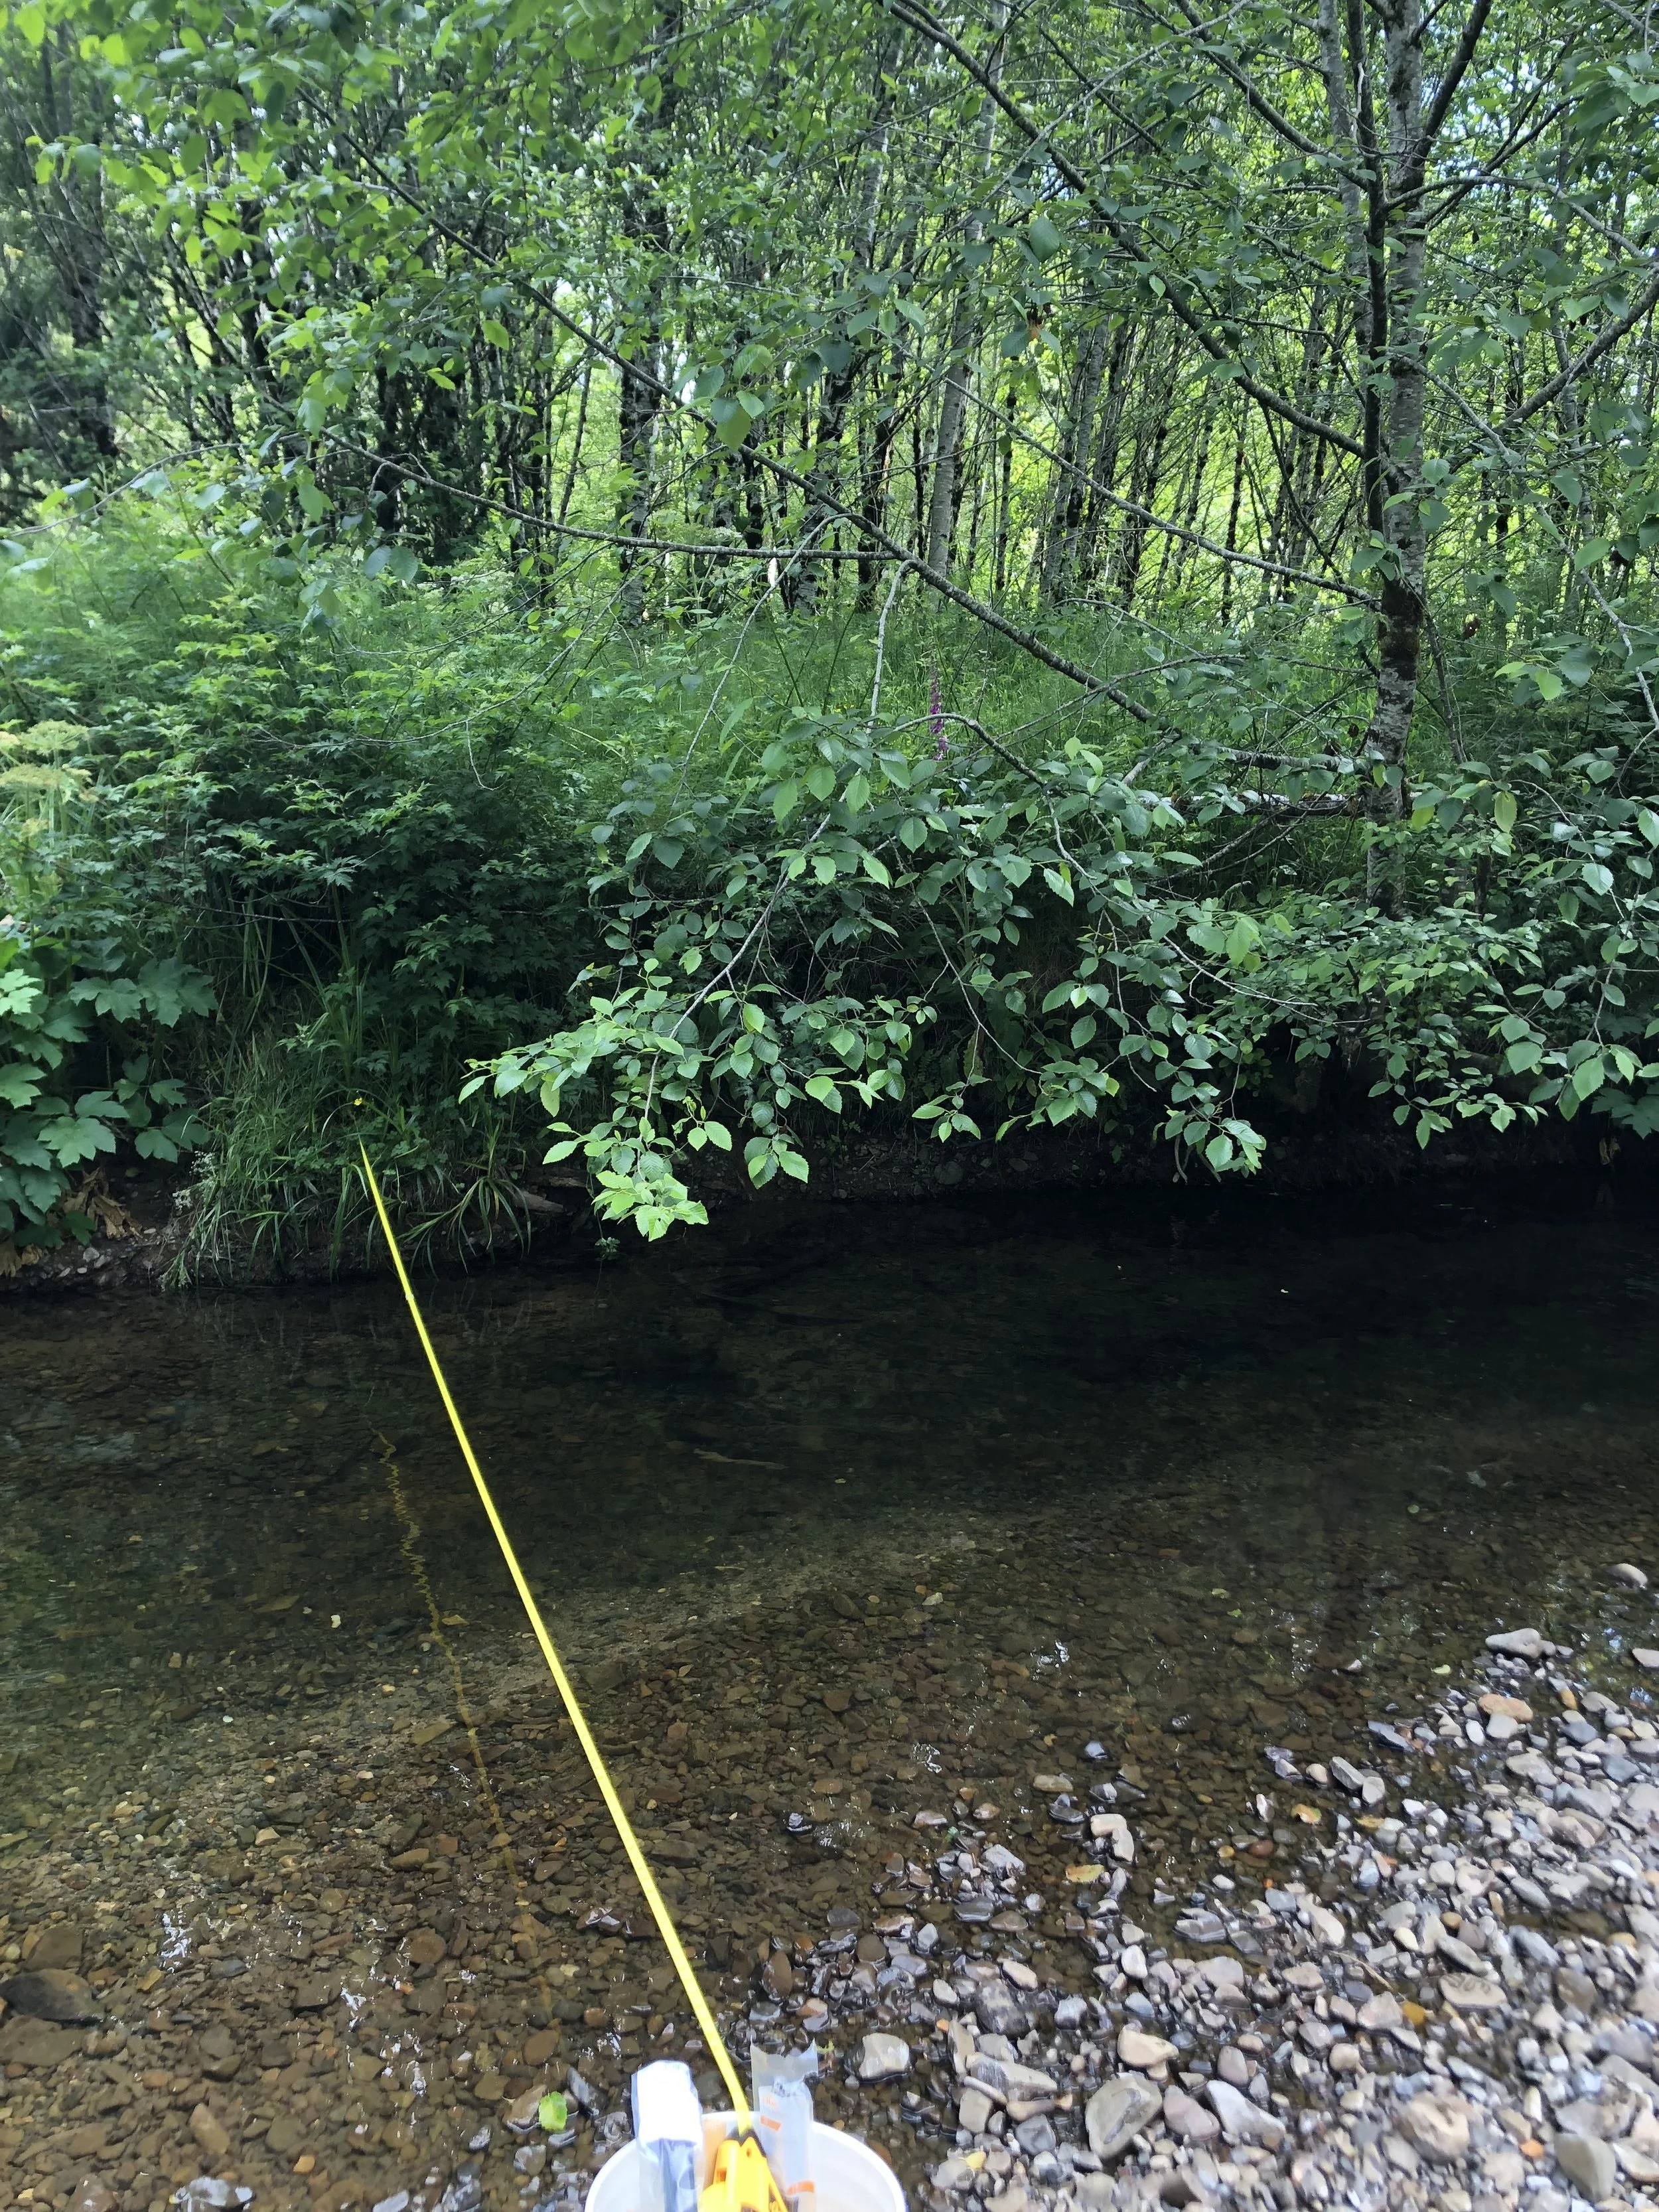
bear creek near svensen market road
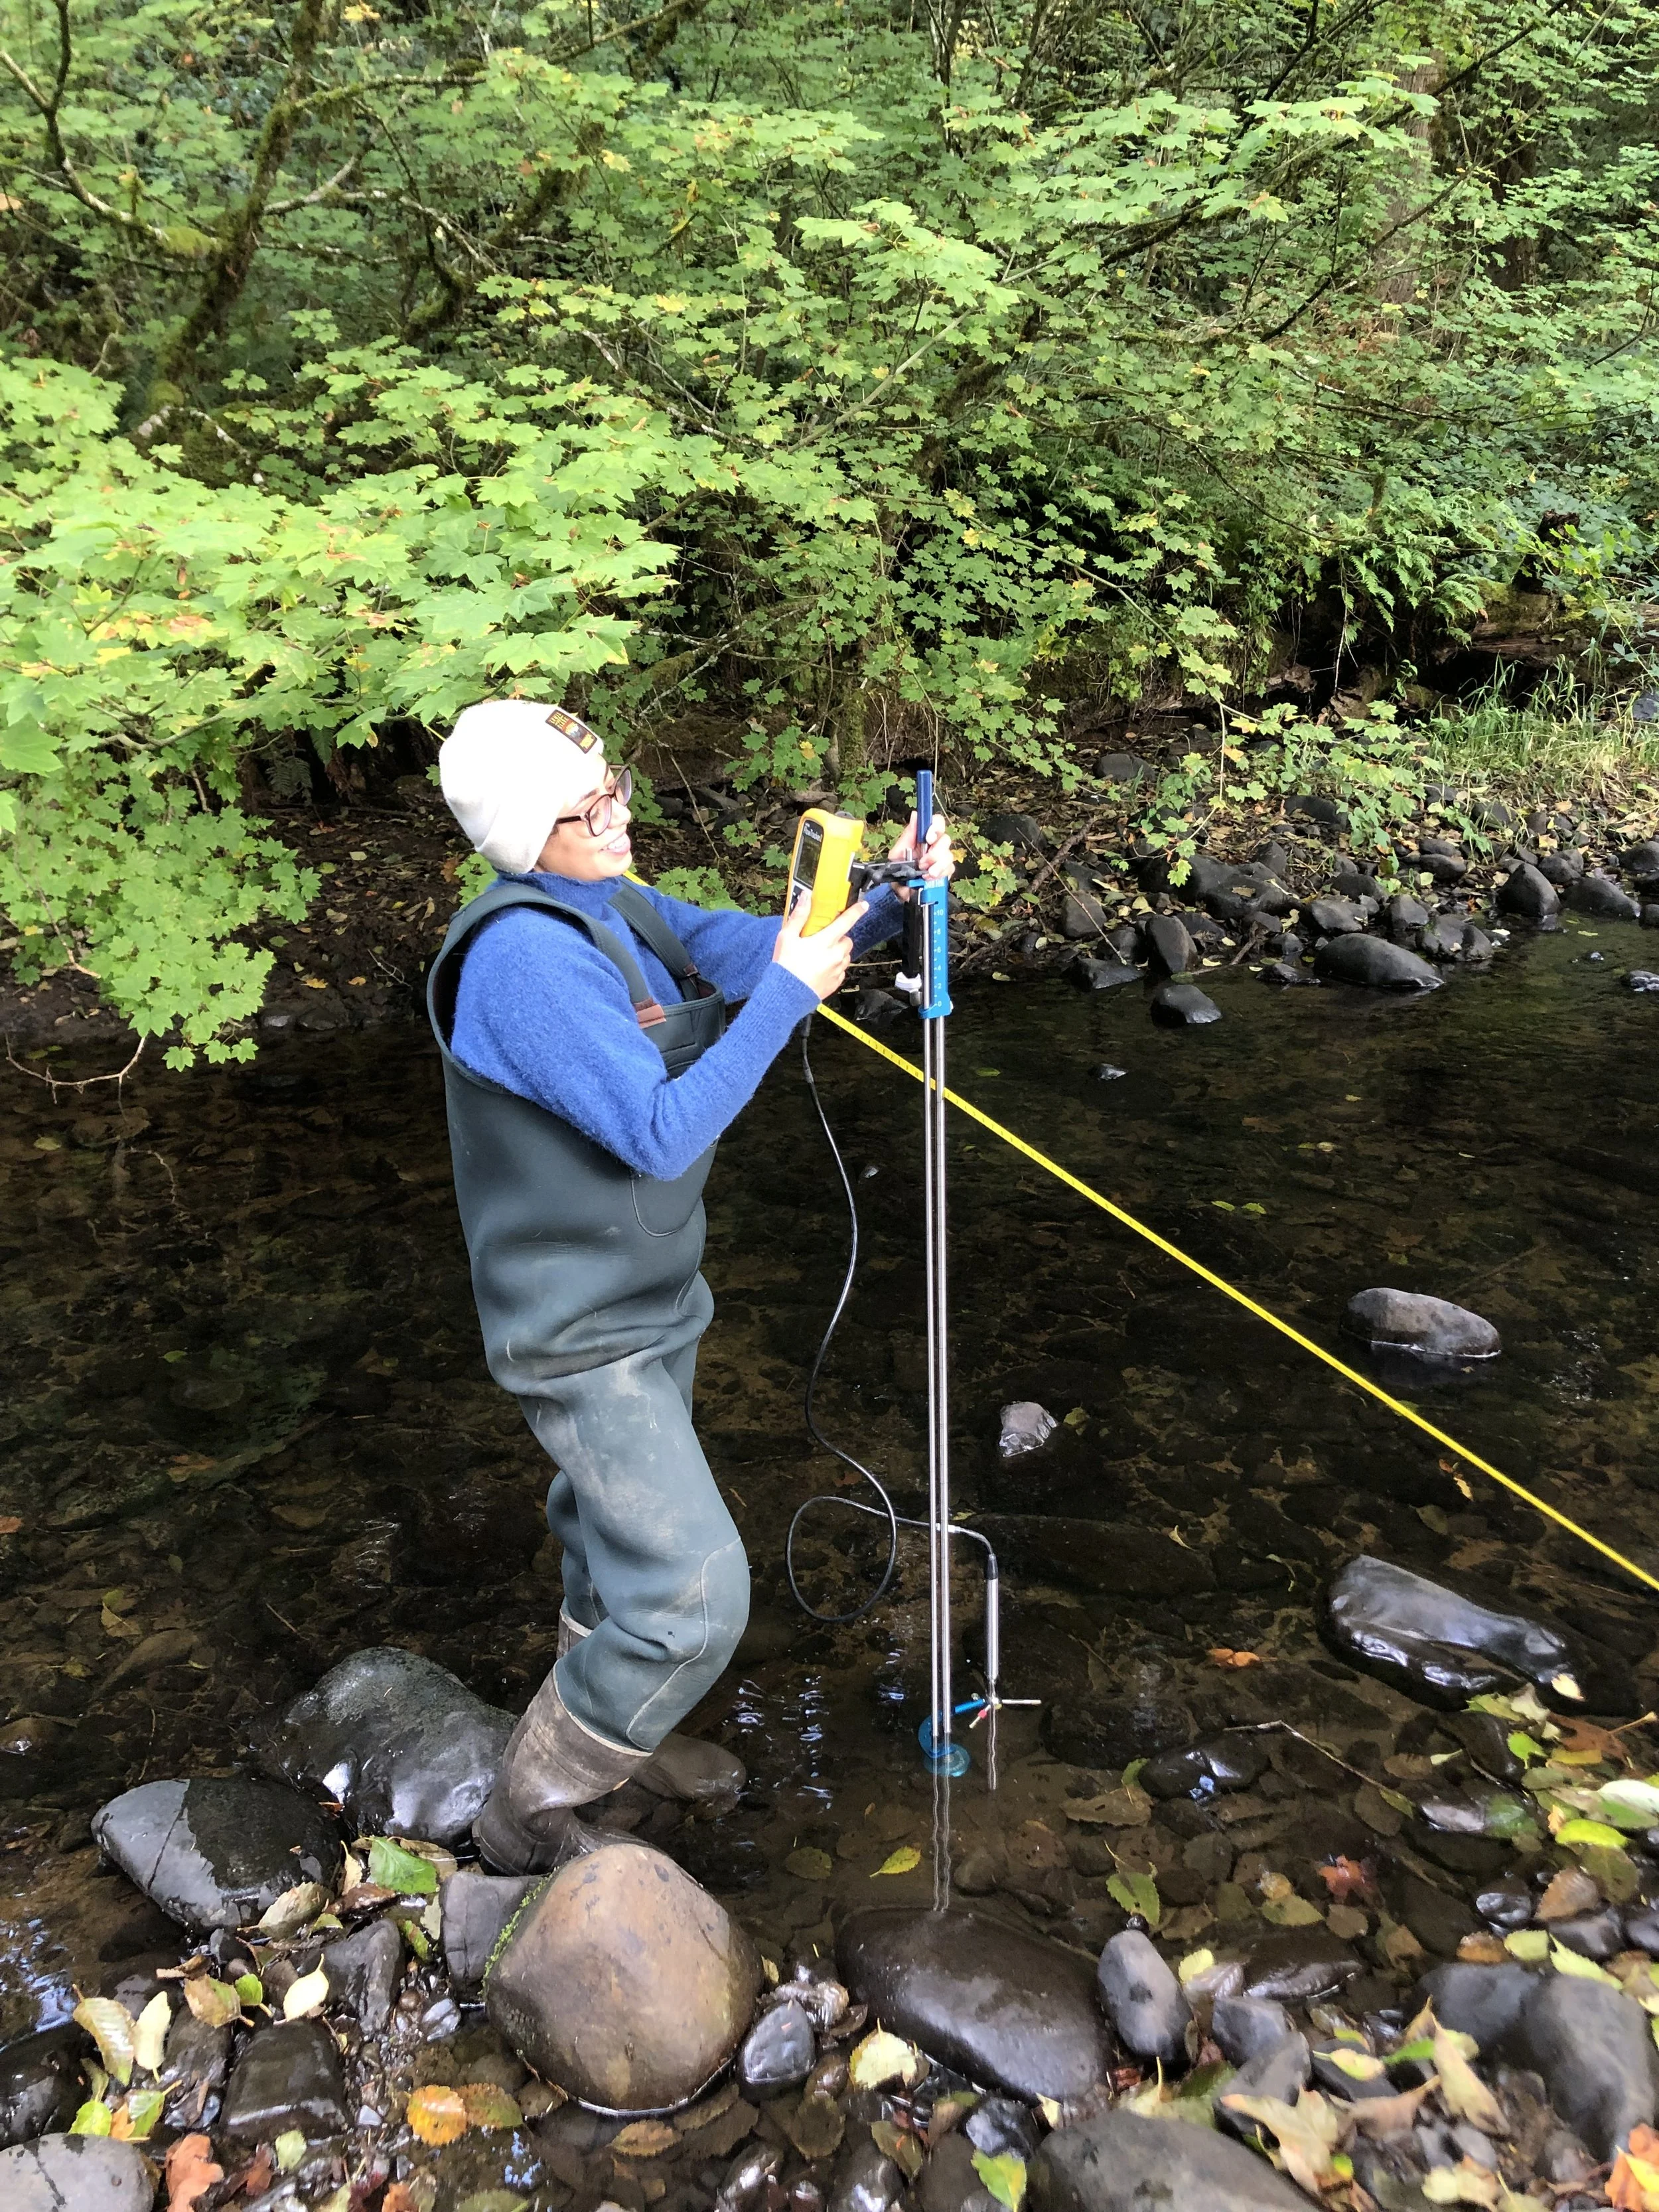
Volunteer Kayla Fermin takes a flow measurement along Bear Creek
Bear Creek near Svensen Market Road was a tricky site to monitor for the very low flows and complex cobbles within the area. The City of Astoria’s drinking water intake is located approximately 3 miles upstream on Bear Creek.
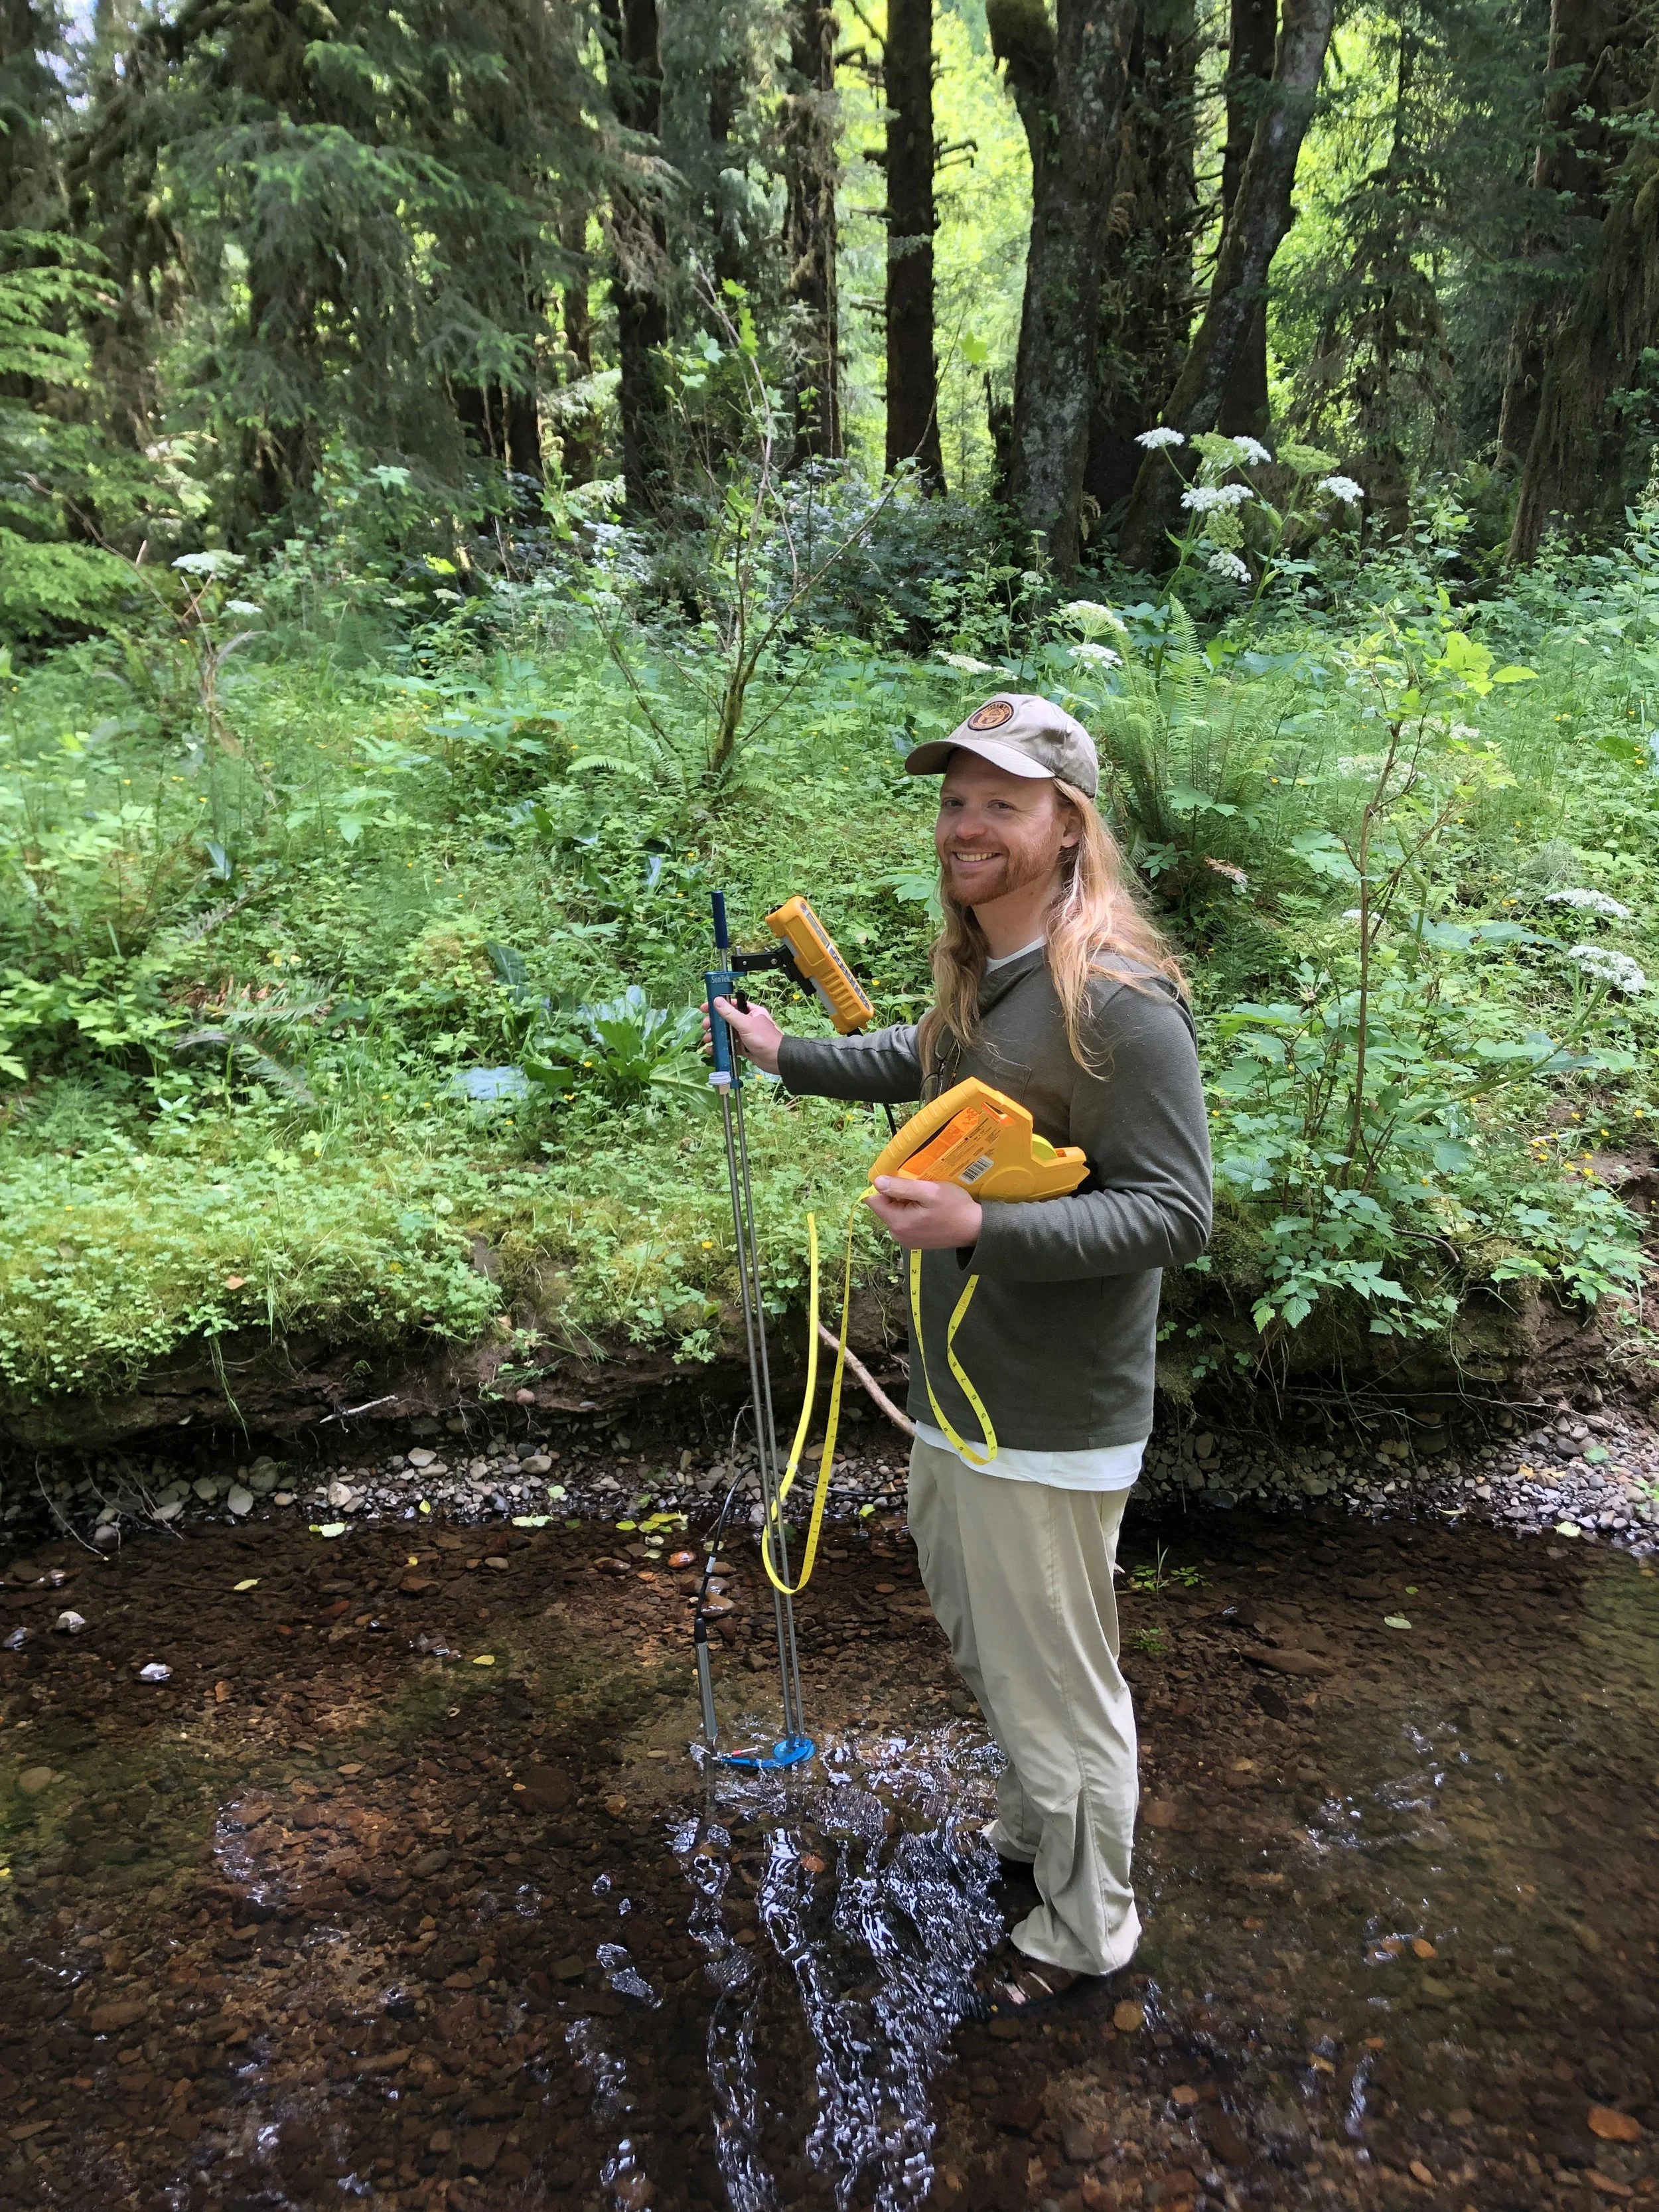
nnf klaskanine river
This site is just above the Klaskanine Salmon Hatchery’s water intake dam on the NNF Klaskanine River where we participated in the installation of a roughened channel to allow fish to swim over the dam.
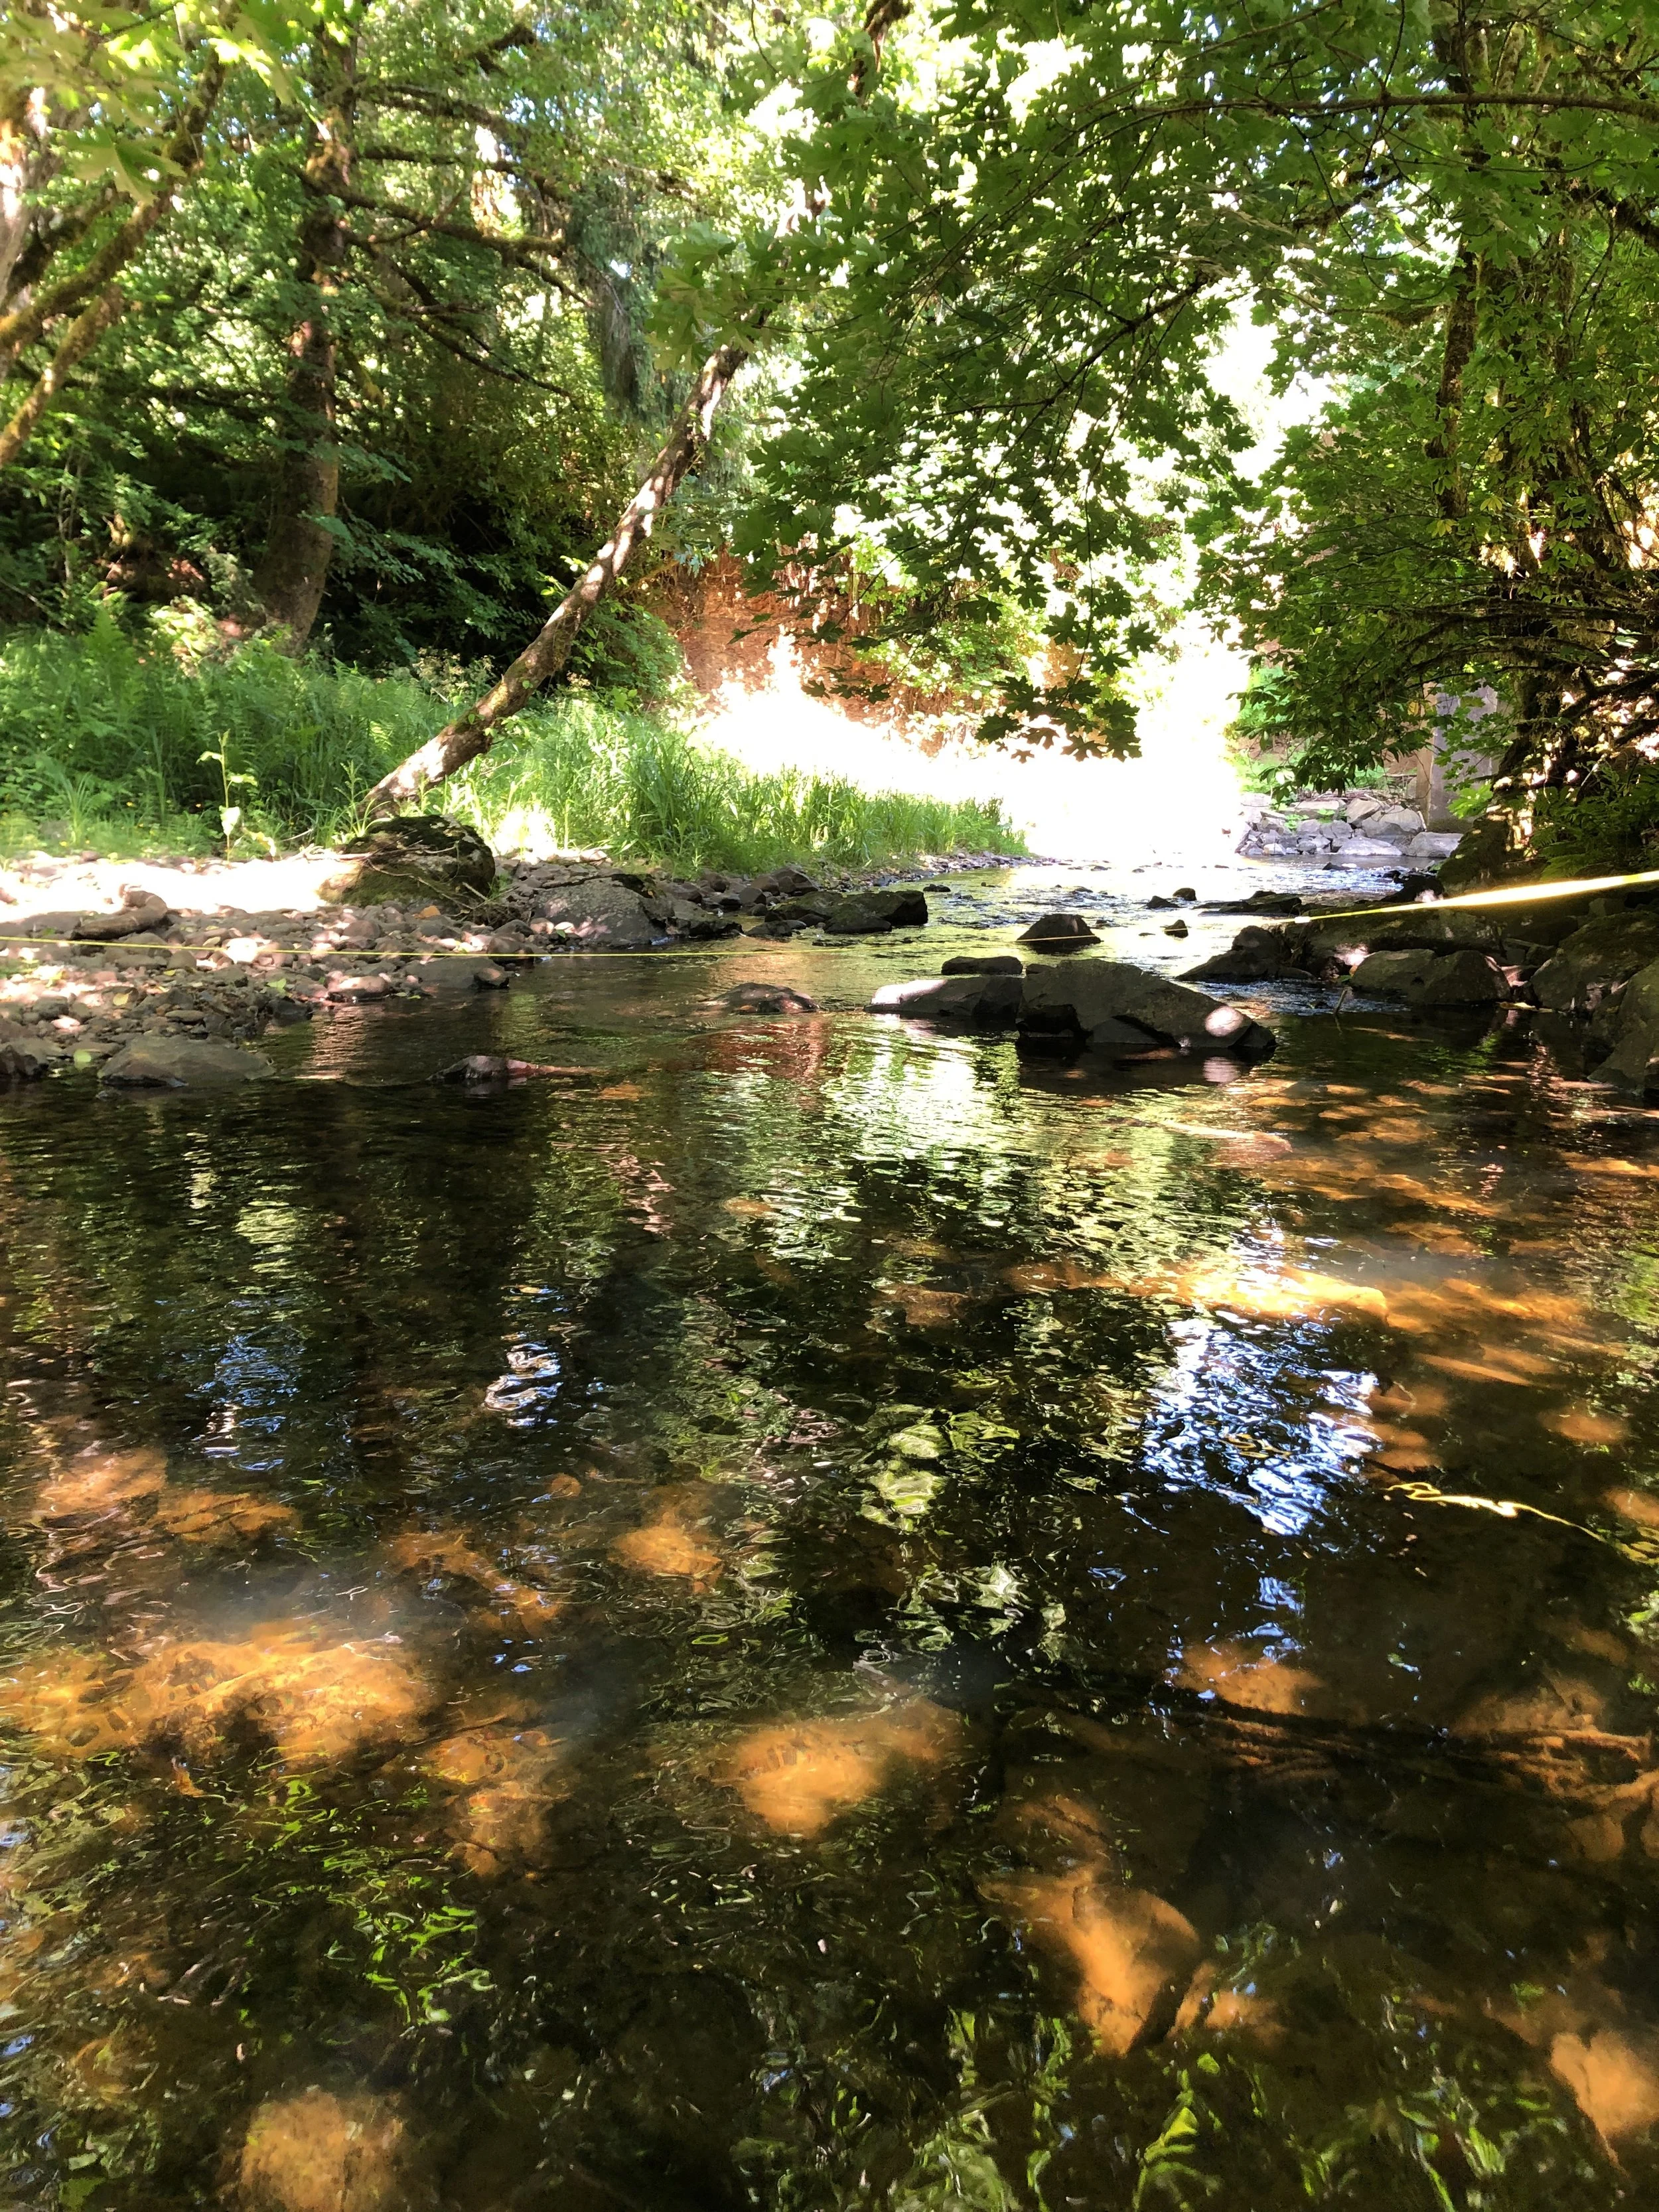
lewis and clark river above fish ladder
Volunteer John Walker Knight sets up to monitor a tributary of the Lewis and Clark reservoir.
The Lewis and Clark River provides summer drinking water to the City of Warrenton which operates a dam just below this site. In addition to the Lewis and Clark River a small tributary flows into the City’s reservoir, whose flow was also measured and is reflected in this graph.
for more information about our flow monitoring program
Email Kelli at kelli@northcoastwatersheds.org